DevOps - DORA Metrics
Hey, we are doing DevOps now. We are 20% more productive. — Are you really? Do you ship 20% faster? Do you have 20% less bugs? And most importantly — How do you measure these? Let's talk about metrics and how you can really measure your DevOps efforts.


Hey, we are doing DevOps now. We are 20% more productive. — Are you really? Do you deliver 20% more products to your customers? Do you ship 20% faster? Do you have 20% less bugs? And most importantly — How do you measure these?
Let's talk about metrics and how you can really measure your DevOps efforts.
DevOps
DevOps, often connected to container technologies, CI/CD, cloud and more is, in the end, not about technology. These technologies empower us to do what is desired in DevOps, but they are not the foundation.
In the past, I already talked about ideals, principles, ways of working and much more. So, in case you are new to DevOps, please check these articles out, first. Yet, if you already know this stuff, you might wonder how you can measure your success.
So, let's check out how you can start.
Measures, Metric, KPI
Before digging into DORA metrics, I want to give a brief understanding of some wording. Words like "measurement", "metric" or "Key performance indicator (KPI)" have a touch of management jargon. Yet, often we are not differentiating them properly or even mix them with each other. Therefore, here is a quick rundown:
- Measures are simple, objective numbers. These are single data points, even if they were calculated from something. You might think of "current time", "state of bank account" or "amount of story points".
- Metrics are measures examined over a period of time. You might think of a diagram showing "weight over the last 12 months" or "tons of tomatoes processed per week". Typically, we combine these with a goal, to showcase what we aim for.
- KPIs are our most important metrics. All KPIs are metrics, but not all metrics are KPIs. KPIs should directly link to our major goals, their outcome, and maybe key results.
Now, that this is out of the way, let's combine metrics with DevOps.
DORA Metrics
DevOps Research and Assessment (DORA) provides a standard set of metrics, that should be useful measuring your success in DevOps. You may add more, remove some or adjust them to your liking. For the start in DevOps, and if you don't know where you are lacking, they should be considered mandatory.
DORA
You might wonder who DORA is. On the official website dora.dev, you can read:
DORA is the largest and longest running research program of its kind, that seeks to understand the capabilities that drive software delivery and operations performance. DORA helps teams apply those capabilities, leading to better organizational performance.
Let's say, this is the truth, but there is more to it.
DORA originated as a team at Google Cloud focusing on assessing DevOps performance. The goal was to improve performance and collaboration. In the past, the group published their findings on a regular basis, and you can find these publications online.
One of the most interesting parts is the so-called quick check, which directly links to the following metrics. I strongly recommend to the check and get a quick understanding where you might need additional support.
Done? Cool, let's continue with the metrics.
Deployment frequency
How often do you deploy to production? Once a week, once a month, once a year? Faster deployments keep changes small, reduce the risk, allow faster feedback from customers and ensure that the routine of deploying software is well automated.
Deployment frequency is the number of daily finished code deployments to any environment. Yet, I am taking production only. The metric takes these measures on a timeline.
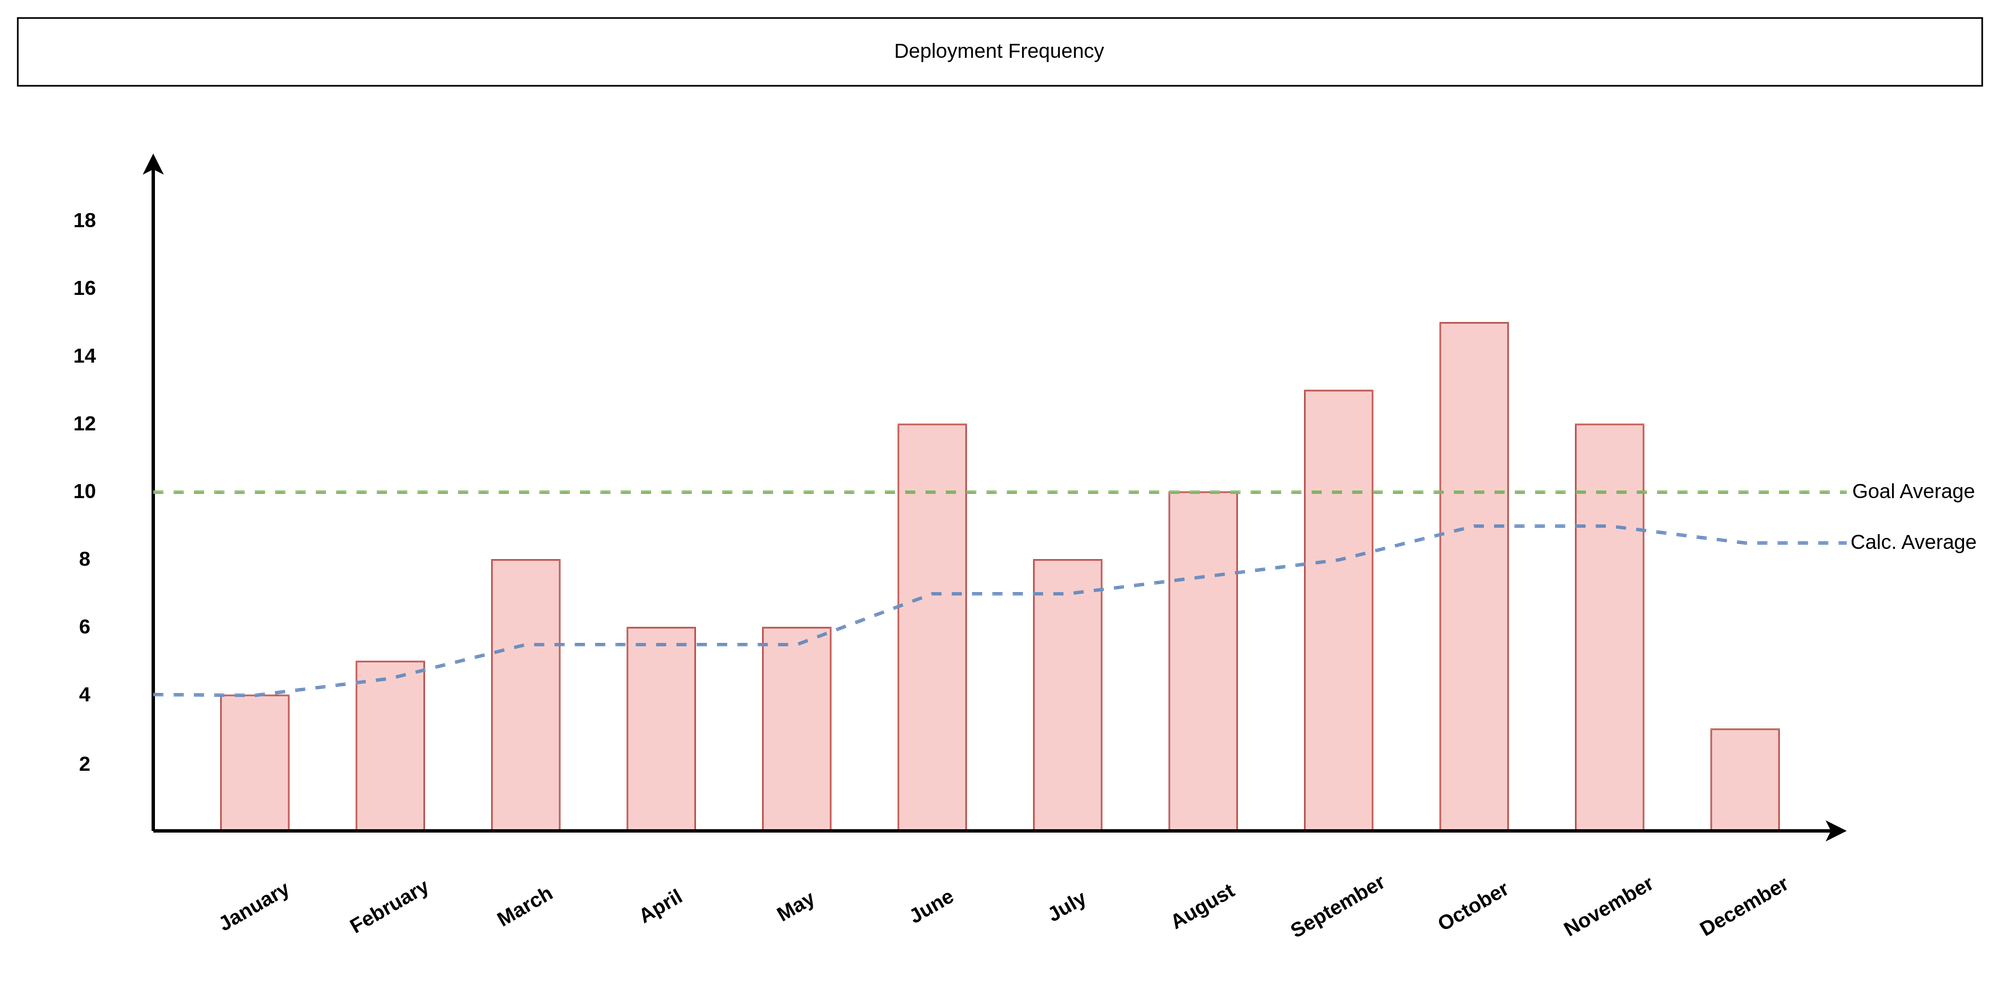
It indicates the overall efficiency of, as it measures the speed of the development team and their level of automation. The easiest way to increase deployment frequency is reducing the amount of changes per deployment.
In case you release a software which will be installed by customers on their own, you may take the final release as a measure or deployments to your own production environment. Yes, it is a good idea to run your own software in your company. "Eat your own dog food", right?
Lead time for changes
Next, you want to see how long it takes to publish something. How long does it take to publish a commit to production? How long does it take from "code committed" to "code successfully running in production"?
Lead time for change is the time between a commit and its successful deployment or release to the public. You can take the daily average or each change individually.
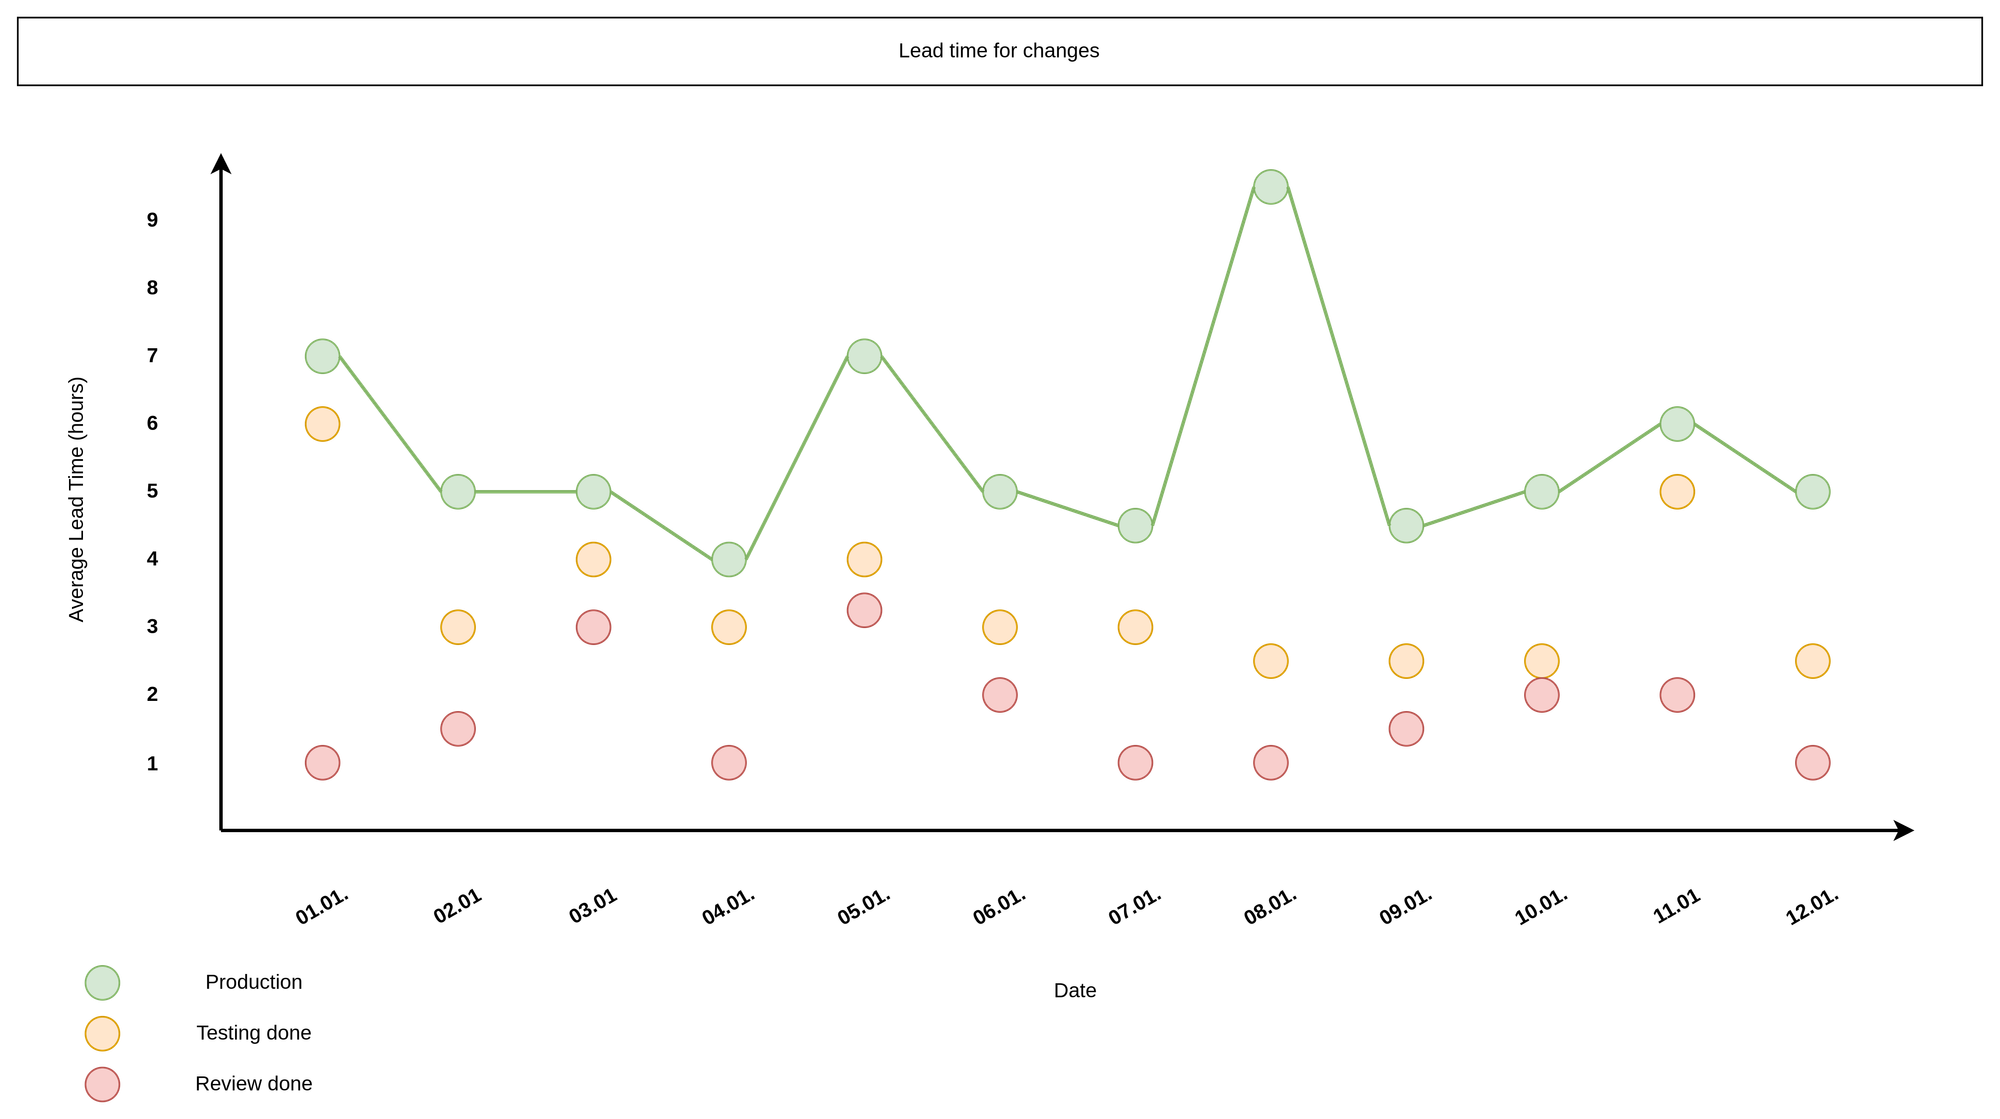
This metric helps you quantify code delivery speed to the customer or business. If you facilitate good review practices, CI/CD and proper deployment processes, you might get 1–4 hours, some teams do need weeks, some even longer. You can also draw conclusions which part of your deployment process takes very long. Is it manual testing? Do reviews happen on a daily basis or at the end of a sprint, etc.
Some changes you can make to reduce lead time are good review practices, conventional commits, automatic changelogs, CI/CD, automated tests and automation of your processes in general.
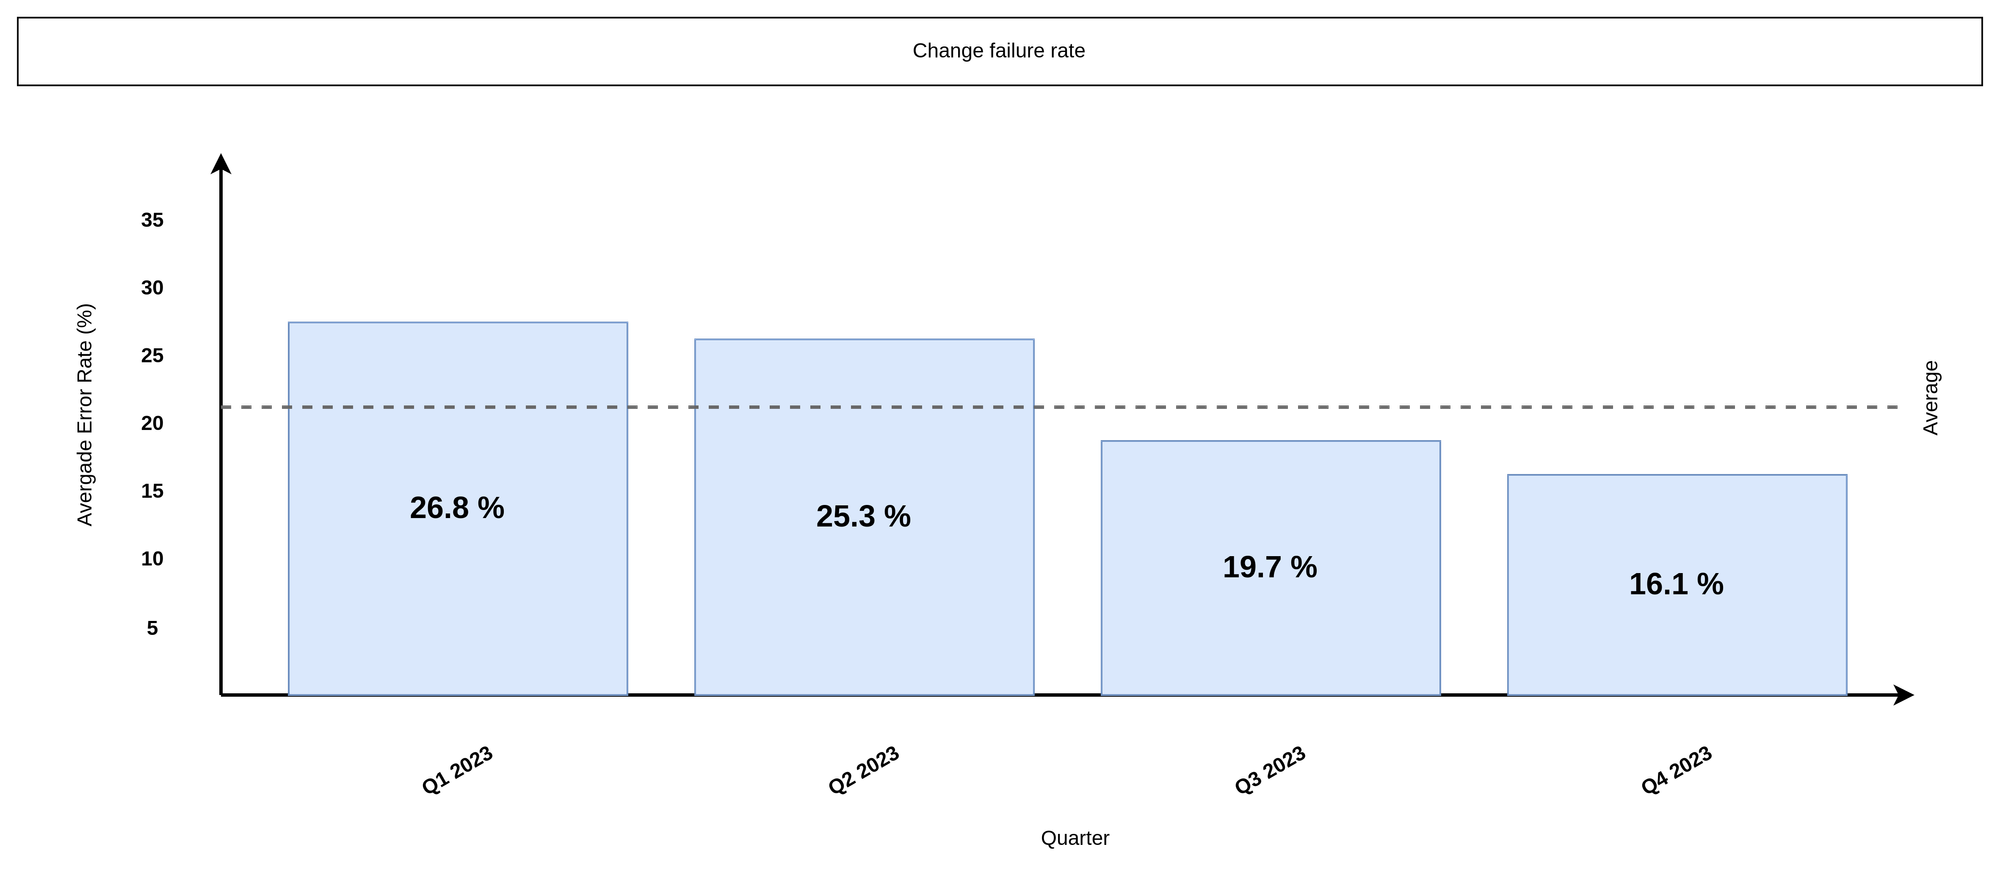
Change failure rate
Change failure rate is a tricky one. On a high level, it is a countermeasure to the first two metrics. It tracks the errors or issues that cause problems for customers after a deployment to production.
This metric is generally speaking a bit harder to measure. There can go something sideways right after a deployment or be discovered weeks later from a user, that just found some time in his backyard to report the bug. Errors can be a thing of higher load, bad behavior, typos, bad documentation or simply a forgotten dialog. Normally, you consider at least these four measures a failure:
- if a monitoring tool alerts you
- if a rollback is required
- if a test in production fails
- if your service is (partly) not available
Anyway, it is a good idea to keep track of these and put them in a timeline.
Now, how does this metric help you? Well, it shows how mature your deployment process is. A failure might be the result of bugs in your software, or they could be caused by permission issues, configuration issues, or dependencies on other systems. A failure also does not mean a complete outage. Instead, it may result in performance degradations, bad availability of services or unexpected high memory consumption on your machines.
In many cases, reducing the work in progress may lead to improved stability and fewer failures. Also, decoupling services can improve the rate and automated tests can have a huge impact, too.
Time to restore service
Lastly, you might consider that something has gone wrong. And let's be honest, things will go south, it's just a matter of time. Now, how fast are you with recovering from these? How good works your rollback, recovery, and bug fixing process?
This metric is also known as "meantime to recovery (MTTR)" and indicates how long your team needs from "knowing of an issue" to "solving the issue".
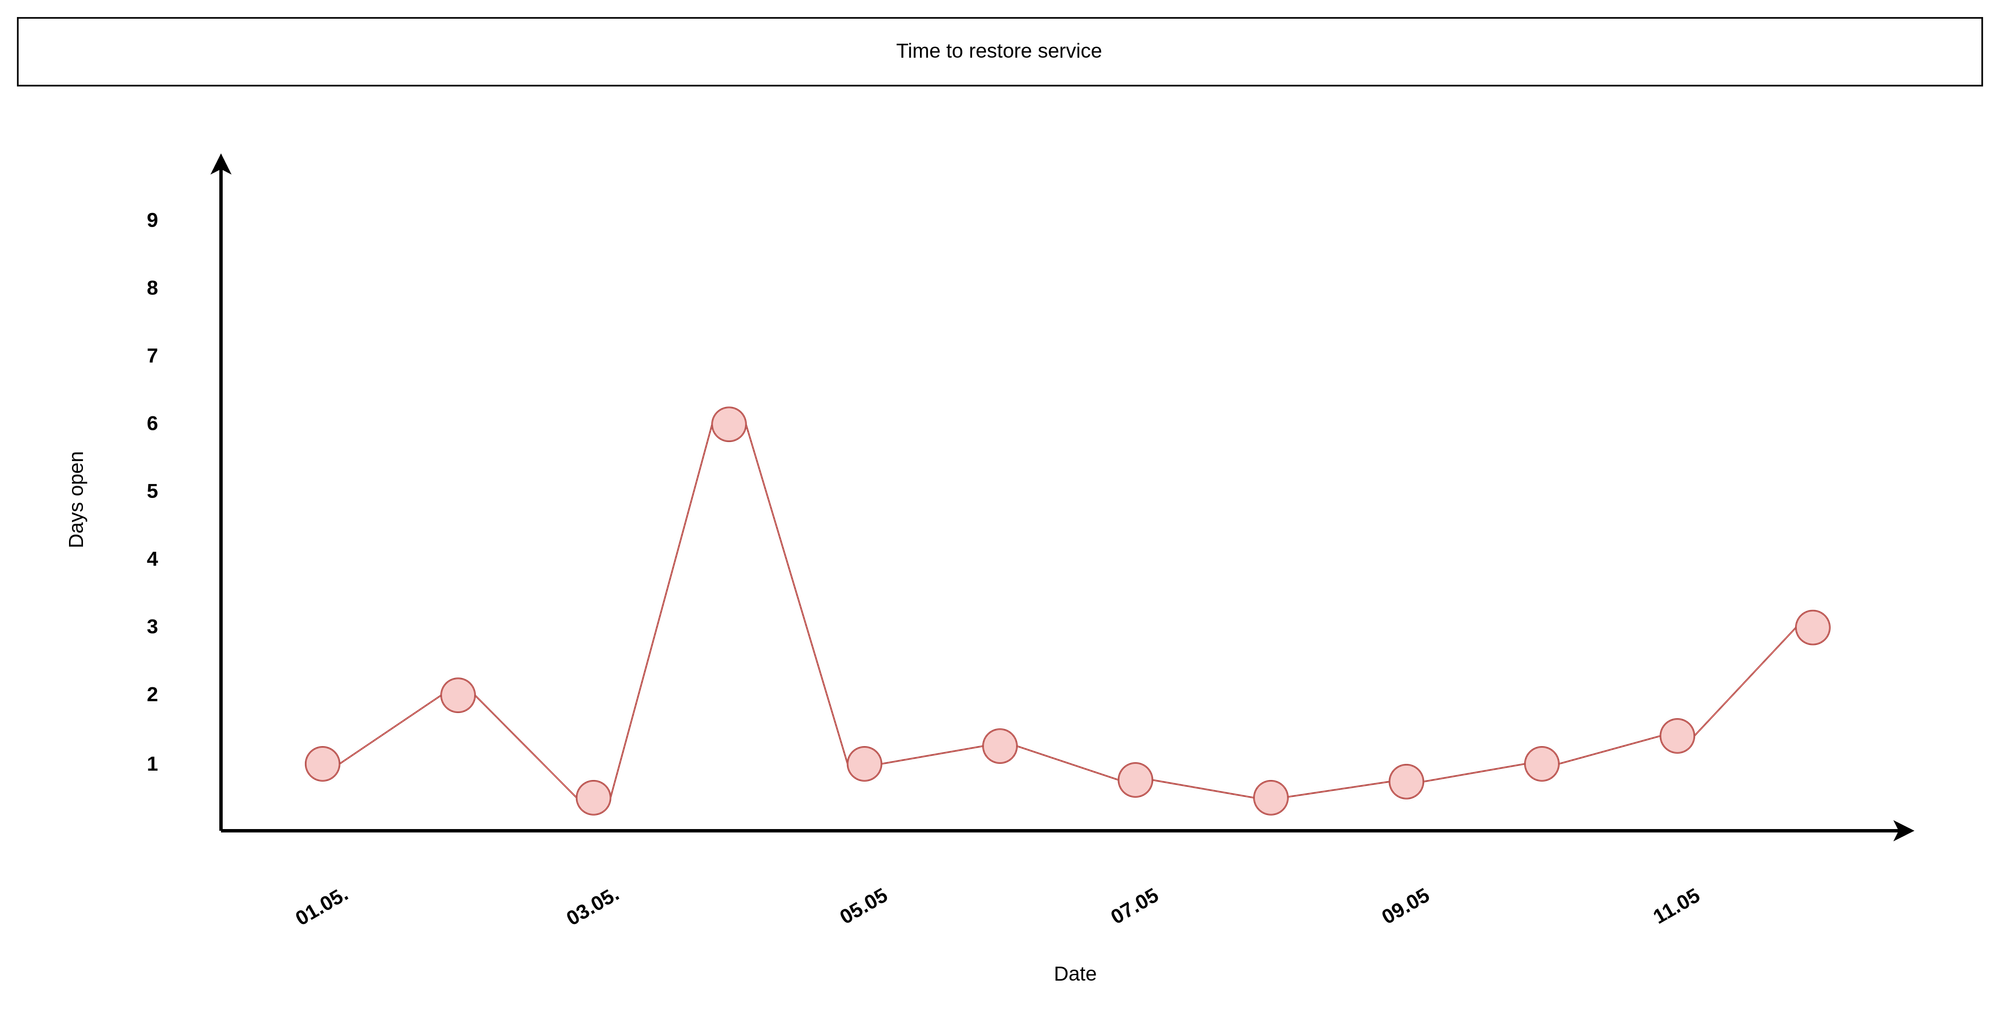
Don't mix this up with meantime to repair, which starts after an issue was assigned to the team. Tracking the time to restore a service really needs to be done right after an issue is known. You can split the steps up into different stages, similar to the lead time for changes diagram, though.
A well-designed response plan, canary deployments or A/B testing will help to mitigate issues quickly. Proper rollback and patching mechanisms are also key.
Docs & Links
In case you want to learn even more about DORA metrics, you can find some articles and guidance in the web.


Conclusion
I really hope that these initial metrics help you to get a better understanding of your maturity in DevOps. Measuring success is key for continuous improvement and transparency. You will learn more from failures and proper data than from guesswork and gut feelings.
Do you already track your metrics? Any suggestions what should be added or wasn't helping a lot? Let me know, please. I am eager to expand my knowledge, too.